Joey Segura
-
Sep 6, 2024
"The time to buy is when there's blood in the streets."
- Baron Rothschild
When it comes to stocks, crypto, or even trading Pokémon cards, the guy with the better market insight is likely going to come out on top, and few metrics give better insight than the Fear and Greed Index.
The Fear and Greed index is an indicator created by CNNMoney in 2012, but the concept of making investment decisions based on the market's broader emotional sentiment is far from new.

So how does it work? The Fear and Greed Index uses 7 different indicators to gauge overall market sentiment and provides insight into the emotional tendencies of investors.
Stock Price Momentum: S&P 500 vs. its 125-day MA
Stock Price Strength: Stocks hitting 52-week highs vs. those hitting 52-week lows
Stock Price Breadth: Trading volume in rising vs. declining stocks
Put and Call Options: The ratio of active put and call options
Junk Bond Demand: The spread between yields on investment-grade bonds and junk bonds
Market Volatility: CBOE's Volatility Index 50-day MA
Safe Haven Demand: The difference between stock returns and treasuries
If you didn't understand all that, don't worry, most people don't. The general idea is:
Fear = Dumb money panic selling.
Greed = Dumb money buying the euphoria.
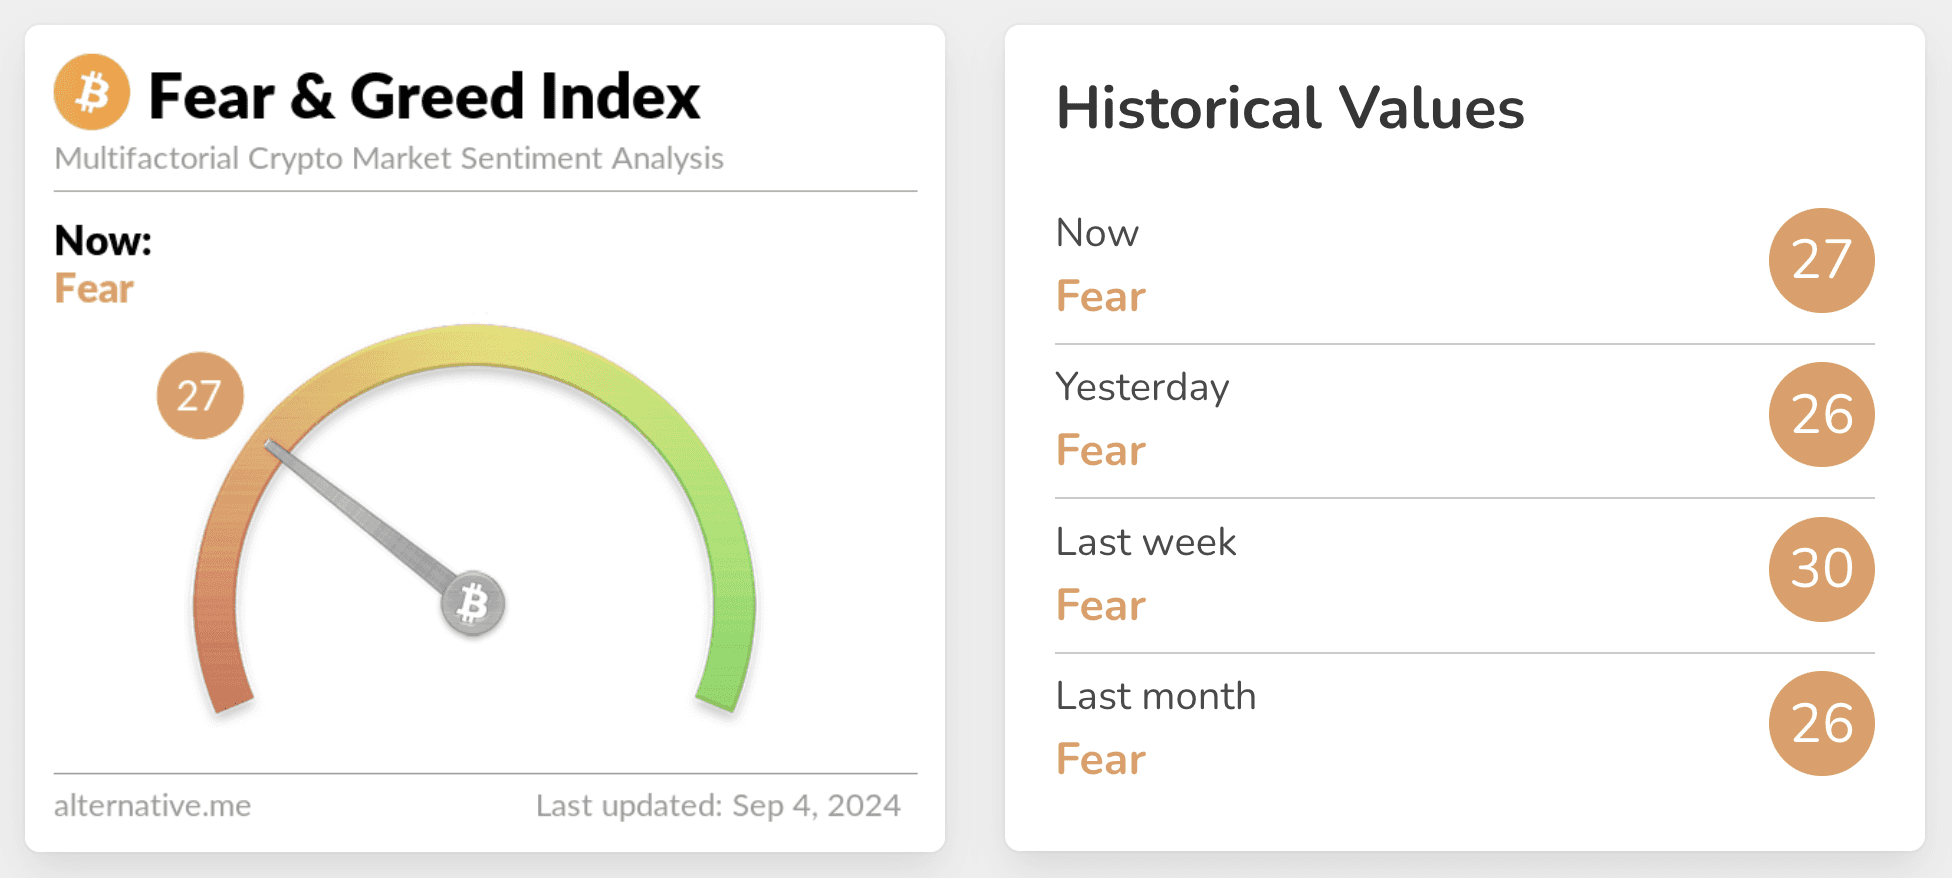
Currently, we're pretty deep in the panic phase.

Like most things in the unpredictable world of investing, the Fear and Greed Index is more of a "vibes" thing than a hard and fast rule.
But it can be valuable for checking yourself when things seem too good to be true or regaining composure when you're starting to think all is lost.
And when you are ready to buy, sell, or swap out a position, there's no better place to do it than the Giddy app.
- Joey Segura

